Stock Market Volatility Historically Followed by Strong Gains, Analysts Say
Periods of high volatility in the stock market are often followed by strong returns, according to new analysis from the Wells Fargo Investment Institute. Historically, when the VIX index — Wall Street’s “fear gauge” — spikes above 40, the S&P 500 has gained an average of 30% over the following year, according to Wells Fargo’s review of market activity from January 1990 to April 16, 2025.
The analysis also found that during such periods, the odds of positive stock returns 12 months later were above 90%. "Concern is normal, but history has taught us that periods of higher volatility have historically led to higher returns," wrote in the report Edward Lee, an investment strategy analyst at Wells Fargo.

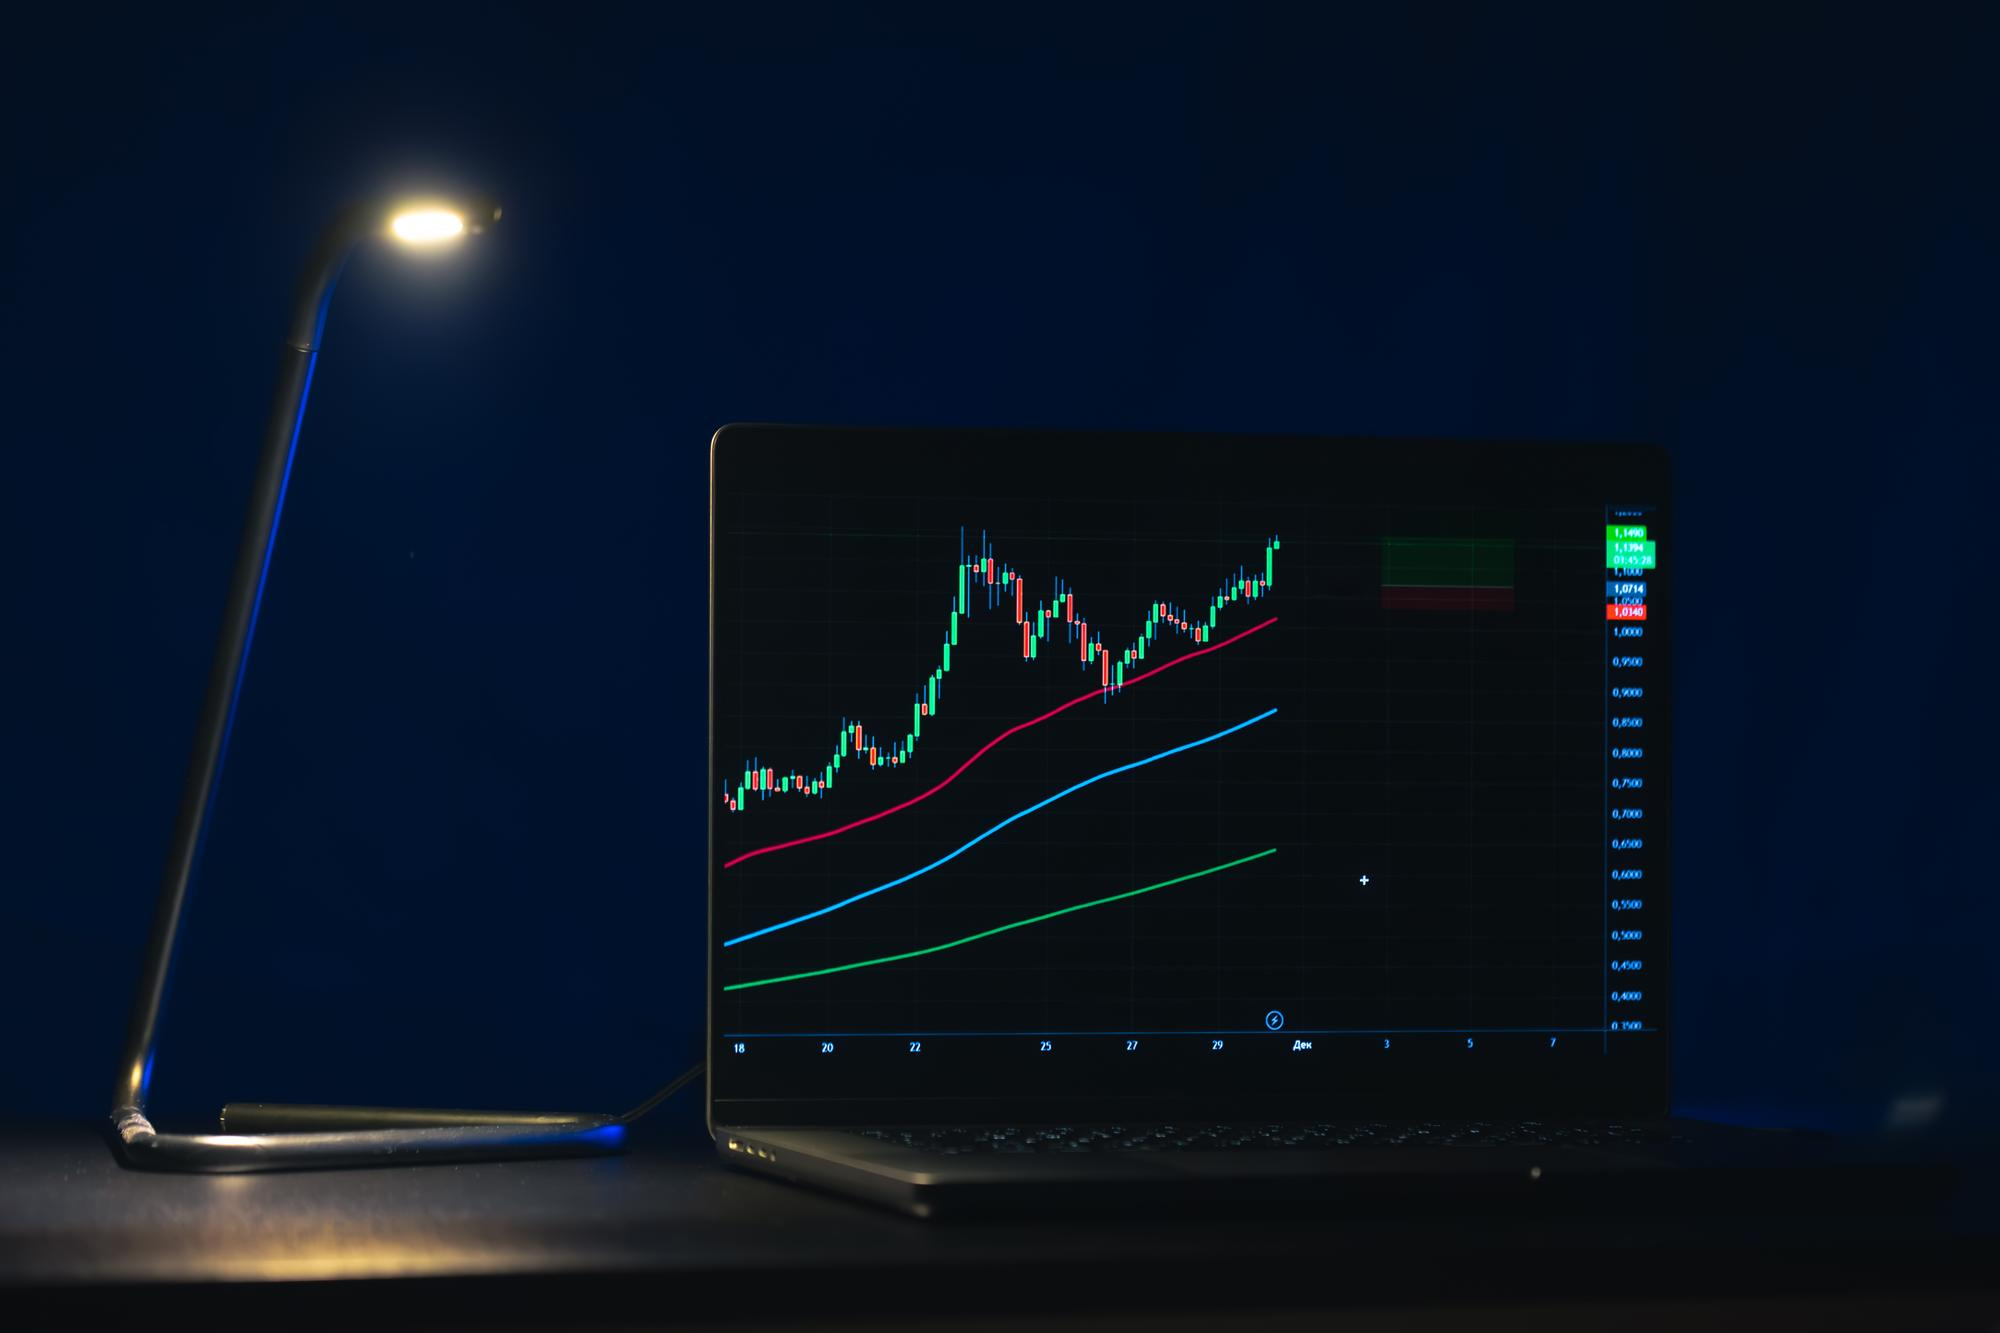
Stock chart | Source: Freepik
Lee emphasized that volatility tends to coincide with investor panic and significant market drawdowns, both of which have historically preceded investment success over the following year.
Market volatility spiked sharply in early April after President Donald Trump announced steep country-specific tariffs, resulting in an almost 11% sell-off in the S&P 500 over two days. The VIX climbed to approximately 53, ranking among its highest historical closes, according to Callie Cox, chief market strategist at Ritholtz Wealth Management.

Man working with stock charts | Source: Freepik
Cox noted that such sell-offs are often “V-shaped,” meaning markets experience a sharp downturn followed by a quick rebound. "The unexpected news part of the sell-off is probably past us, and if you are a long-term investor, now is probably the time to start buying," she said. However, she cautioned that investors should not assume the market has reached the bottom, adding, “History isn’t always gospel.”
