
The Best Remote Performance Analytics Tools for Boosting Team Results
Aug 02, 2026



Monitoring user activity, application speed, and overall system performance often demands constant attention and coordination. As teams work across different time zones, manual tracking quickly becomes overwhelming. With cloud-based tools, teams can automatically gather important data, spot issues before they cause delays, and instantly distribute findings to everyone involved. These solutions help teams detect problems faster and ensure that everyone stays informed with up-to-date information, no matter where they are. By relying on real-time updates, teams can respond quickly to any concerns and keep operations running smoothly.
Automating analytics in the cloud matters because it keeps dashboards current, reduces manual errors and frees up developers to fix bugs, not chase metrics. You access scalable storage, on-demand processing power and built-in connectors to every major service. You’ll see why a setup that once took weeks can now take minutes.
Every metric or event you collect passes through a data pipeline. First, tools capture real-time signals. Then they move data into scalable storage. Finally, dashboards turn raw numbers into colored charts and trend lines. A clear setup helps teams identify slowdowns before they reach customers.
When pipelines break, missing data hides critical issues. You need structured steps to ingest and process logs, traces and metrics without manual intervention. Cloud automation handles this task effectively.
You get a unified view without piecing together spreadsheets. Cloud platforms offer built-in connectors to web servers, databases and front-end frameworks. They auto-scale, so peak traffic spikes won’t crash your pipeline. You pay only for what you use.
Teams across regions see the same dashboards instantly. Alerts trigger in chat channels or SMS. No more late-night phone calls or scrambled screenshots. You fix performance hiccups before they turn into complaints.
Not all platforms meet every need. Look for these essential features:
Platforms like AWS CloudWatch, Azure Monitor and GCP Operations support plugins for popular frameworks. You can use open source agents or native SDKs. The goal is a single console that pulls in all relevant performance signals.
This sequence allows you to go from zero to full monitoring in less than a day. You’ll identify performance patterns almost immediately and stay ahead of slowdowns.
Periodically review your list of metrics to ensure you measure what truly matters. If a dashboard shows flat lines for months, remove it or replace it with more meaningful signals.
Automating performance analytics in the cloud makes troubleshooting easier and helps improve growth. It reduces data collection time and allows more focus on making improvements.

Successful online networking depends on setting clear objectives, reaching out regularly, and forming authentic relationships. Remote teams now rely on video meetings...
Aug 05, 2026

Efficient and secure file sharing plays a vital role in supporting collaboration within any online workspace. Team members rely on quick access to shared spreadsheets,...
Aug 22, 2026

Many people rely on their personal spaces to manage daily work tasks, from handling important files to participating in video meetings and sending private messages. Each...
Jun 24, 2026

Teams work together more efficiently when they use cloud-based file sharing, as it allows everyone to access the same documents from any location. Keeping files in one...
Jul 29, 2026

Handling payroll for teams spread across different countries often brings a unique set of challenges. You balance time zone differences, navigate various currencies, and...
Jul 10, 2026

Daily routines often leave little time for sorting through paperwork and tracking down receipts, which can make reimbursements take longer than necessary. A quick and...
Aug 12, 2026

Using a timer app to track your tasks replaces uncertainty with accurate records. An automated tracker handles time logging for you, so you do not need to log each...
May 12, 2026
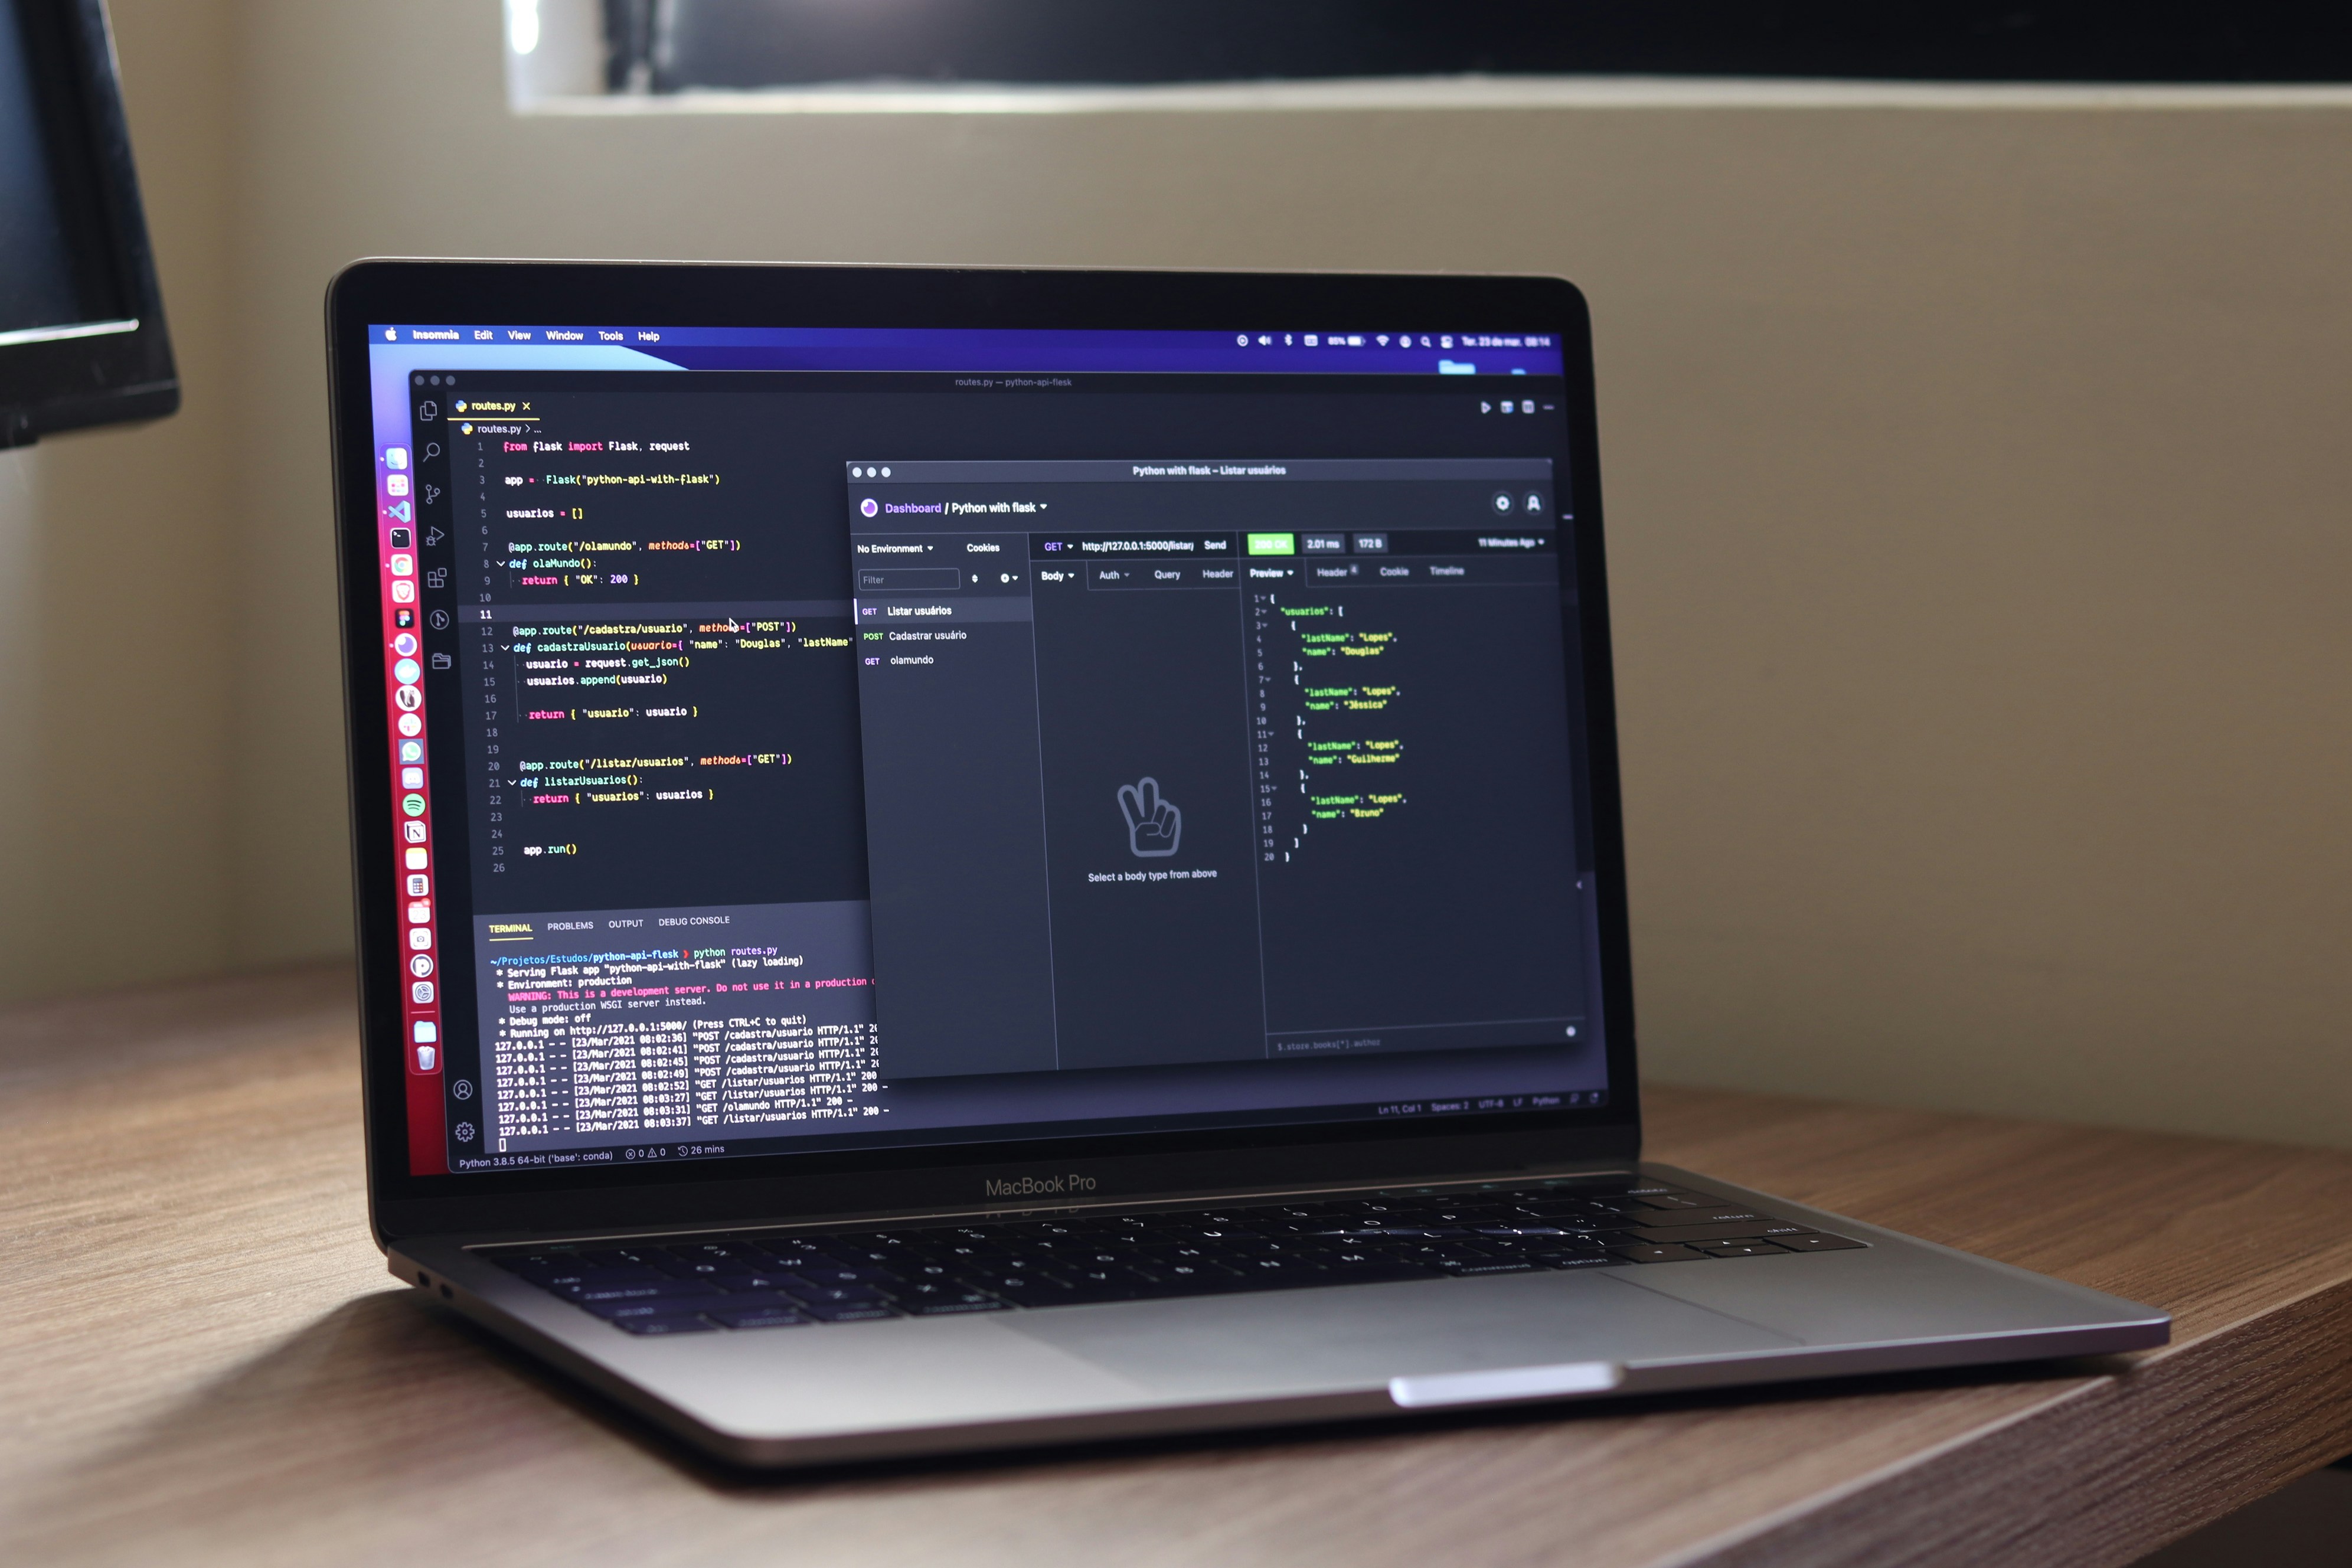
Keeping track of updates and handling tasks in different applications often eats up valuable time and disrupts workflow. When you connect your tools through robust APIs,...
Jun 15, 2026

Managing expenses across multiple currencies becomes much easier with an online banking tool designed for international transactions. The right platform helps you...
Jun 06, 2026

Virtual reality technology brings coworkers together in a shared digital space that feels almost tangible. By slipping on a headset, you can join your team around a...
Jul 24, 2026

Strong global startup teams rely on clear guidance and hands-on methods to work well together, even across different locations. This guide introduces seven ways to help...
May 18, 2026

Diversifying your portfolio beyond your local market opens up new opportunities for growth and helps protect your investments from unpredictable economic shifts. You...
Jul 21, 2026

Teams working across different time zones often face the challenge of maintaining both productivity and personal well-being. Startups frequently manage demanding...
May 27, 2026

Protecting sensitive documents becomes especially important when you work outside a traditional office setting. You want a reliable way to keep your files safe from...
May 09, 2026